


[Alternate title for this protip: Dude, where’s my data?]
The usual approach to figure out the way data flows throughout a codebase is… well, extraordinarily manual. Turns out, there’s a better and faster way to do it.
While this might not always work, especially when there’s Intents and Fragments in the way, it’s still quite useful. Even in those cases, it usually boils down to following the data flow up to a certain boundary, and resuming the automatic tracking on the other end of the rabbit hole.
How did this even get here?
The most common case you might want to track is how a certain set of data got into a certain block of code. That usually happens when responding to a crash report or some other bug that is caused by unexpected data being fed into a method. Being able to pinpoint where that data might be originating is crucial to be able to understand, and then fix, the issue at hand.
In this case, what a dev usually would do is set a breakpoint and try to reproduce the issue, then possibly manually resume execution in the debugger until the condition we care about is met. At that point, you’d scan the stack and see if you can spot where stuff is coming from, or stepping with the debugger to see where it’s going.
If you’ve been following the previous parts in this series, you’ll know this is where I get to say:
That’s not a smart way of doing it.
Conditional (debugger) discharge
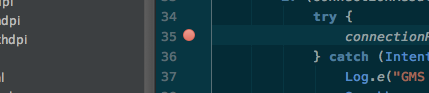
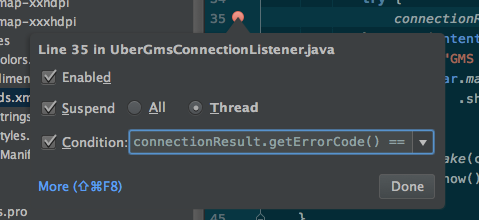
Most people had never noticed that before Nick Butcher posted about it a few months ago, but you can set options for breakpoints in Android Studio.
You can make them automatically log stuff, even without actually stopping the execution. You can make the breakpoint active only when a certain condition is met. You can make them only break on given instances, classes, or only stop after a certain amount of times the breakpoint has been hit. It’s pretty powerful. Do look at the documentation!
This way you will have a much easier life with the debugger. Let the IDE do conditions checks for you! But it wouldn’t be a great protip if I weren’t to suggest an even better way of doing things. In fact:
There’s an even better way of doing it!
Static flow analysis to the rescue
The best way of doing this is actually not even using the debugger. What is this wizardry, you ask? Well, that’s thanks to another very handy functionality of the static analysis toolset built into the IDE: Analyze data flow to/from here.
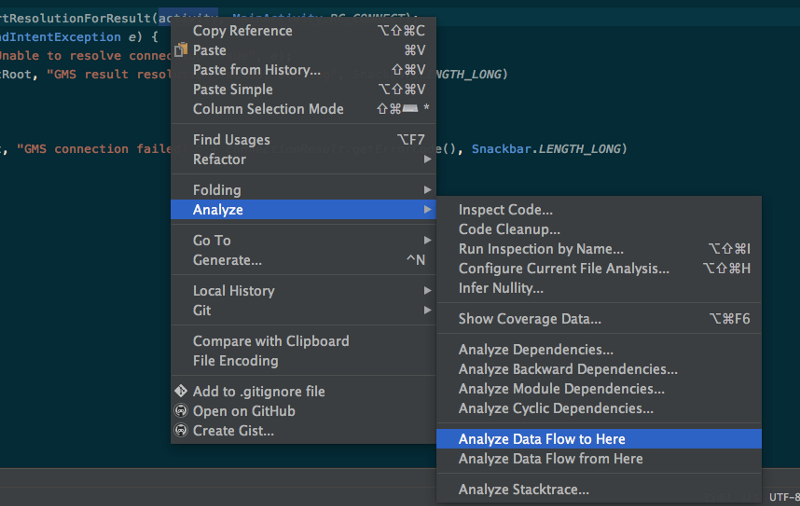
When you use that option, the IDE will figure out all the places that can contribute a value to a variable, parameter or field — or all the places that value will end up into.
If, for example, we want to look at where a value is coming from for a given method, we’d invoke Analyze Data Flow to Here on it. This is what we get for a field in a listener in my Smart Lock for Passwords demo project:
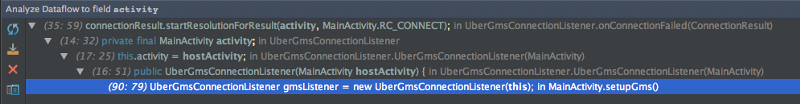
On the other hand, if you wanted to see where the value ends into, you would invoke Analyze Data Flow from Here on the value. For example, finding where a value from the constructor of the listener we’ve just looked at, would give us this:
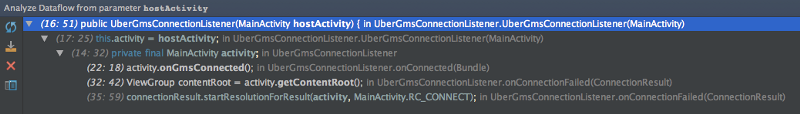
If you enable the code preview in the panel, it’s even easier to follow the data flow through the code!

These are really simple examples that you probably could also figure out with a combination of Find usages and other tools, but there’s times where this makes a huge difference. Besides, it eliminates the human factor in following data around, which can be source of oversights, and simply takes more time.
Want to read more?
You can take a look at the other posts in this series.