In an ideal world, your apps would never crash. Bugs wouldn’t exist, and everything would be working right away.
As you very well know, we do not live in such an idyllic scenario. Crashes do happen. Hopefully when you’re developing, so they’re addressed before they make their way to QA (because you do have QA, right?). Or worse, your users.
When you catch crashes (or other issues that print stack traces) while developing, you have really nice clickable links in the IDE logcat view that bring you right to the problematic line of code.
Unfortunately, this world is far removed from that ideal of perfection. In real life, bugs make their way to QA, and even to end users. Now, when it happens, you’re likely receiving a stack trace copy-pasted into an email, a chat message, or an issue tracker ticket. There’s no nice clickable link.
java.lang.NullPointerException
    at android.databinding.PropertyChangeRegistry$1.onNotifyCallback(PropertyChangeRegistry.java:28)
    at android.databinding.PropertyChangeRegistry$1.onNotifyCallback(PropertyChangeRegistry.java:24)
    at android.databinding.CallbackRegistry.notifyCallbacks(CallbackRegistry.java:201)
 at android.databinding.CallbackRegistry.notifyFirst64(CallbackRegistry.java:122)
    at android.databinding.CallbackRegistry.notifyRemainder(CallbackRegistry.java:169)
    at android.databinding.CallbackRegistry.notifyRecurse(CallbackRegistry.java:145)
    at android.databinding.CallbackRegistry.notifyCallbacks(CallbackRegistry.java:91)
    at android.databinding.BaseObservable.notifyPropertyChanged(BaseObservable.java:62)
...
What most people do in this case is read the name of the class that is most likely to be the cause of the issue, switch to the project pane, look up the file, open it, and scroll to the line.
Well, that’s the least efficient way of doing it.
The better way
You should get acquainted with the various keyboard navigation functions in your IDE. For us, it’s all about Open class (Cmd-O or Cmd-N on Mac) and Open file (Cmd-Shift-O or Cmd-Shift-N). By the way, just switch Cmd with Ctrl for Windows and Linux.
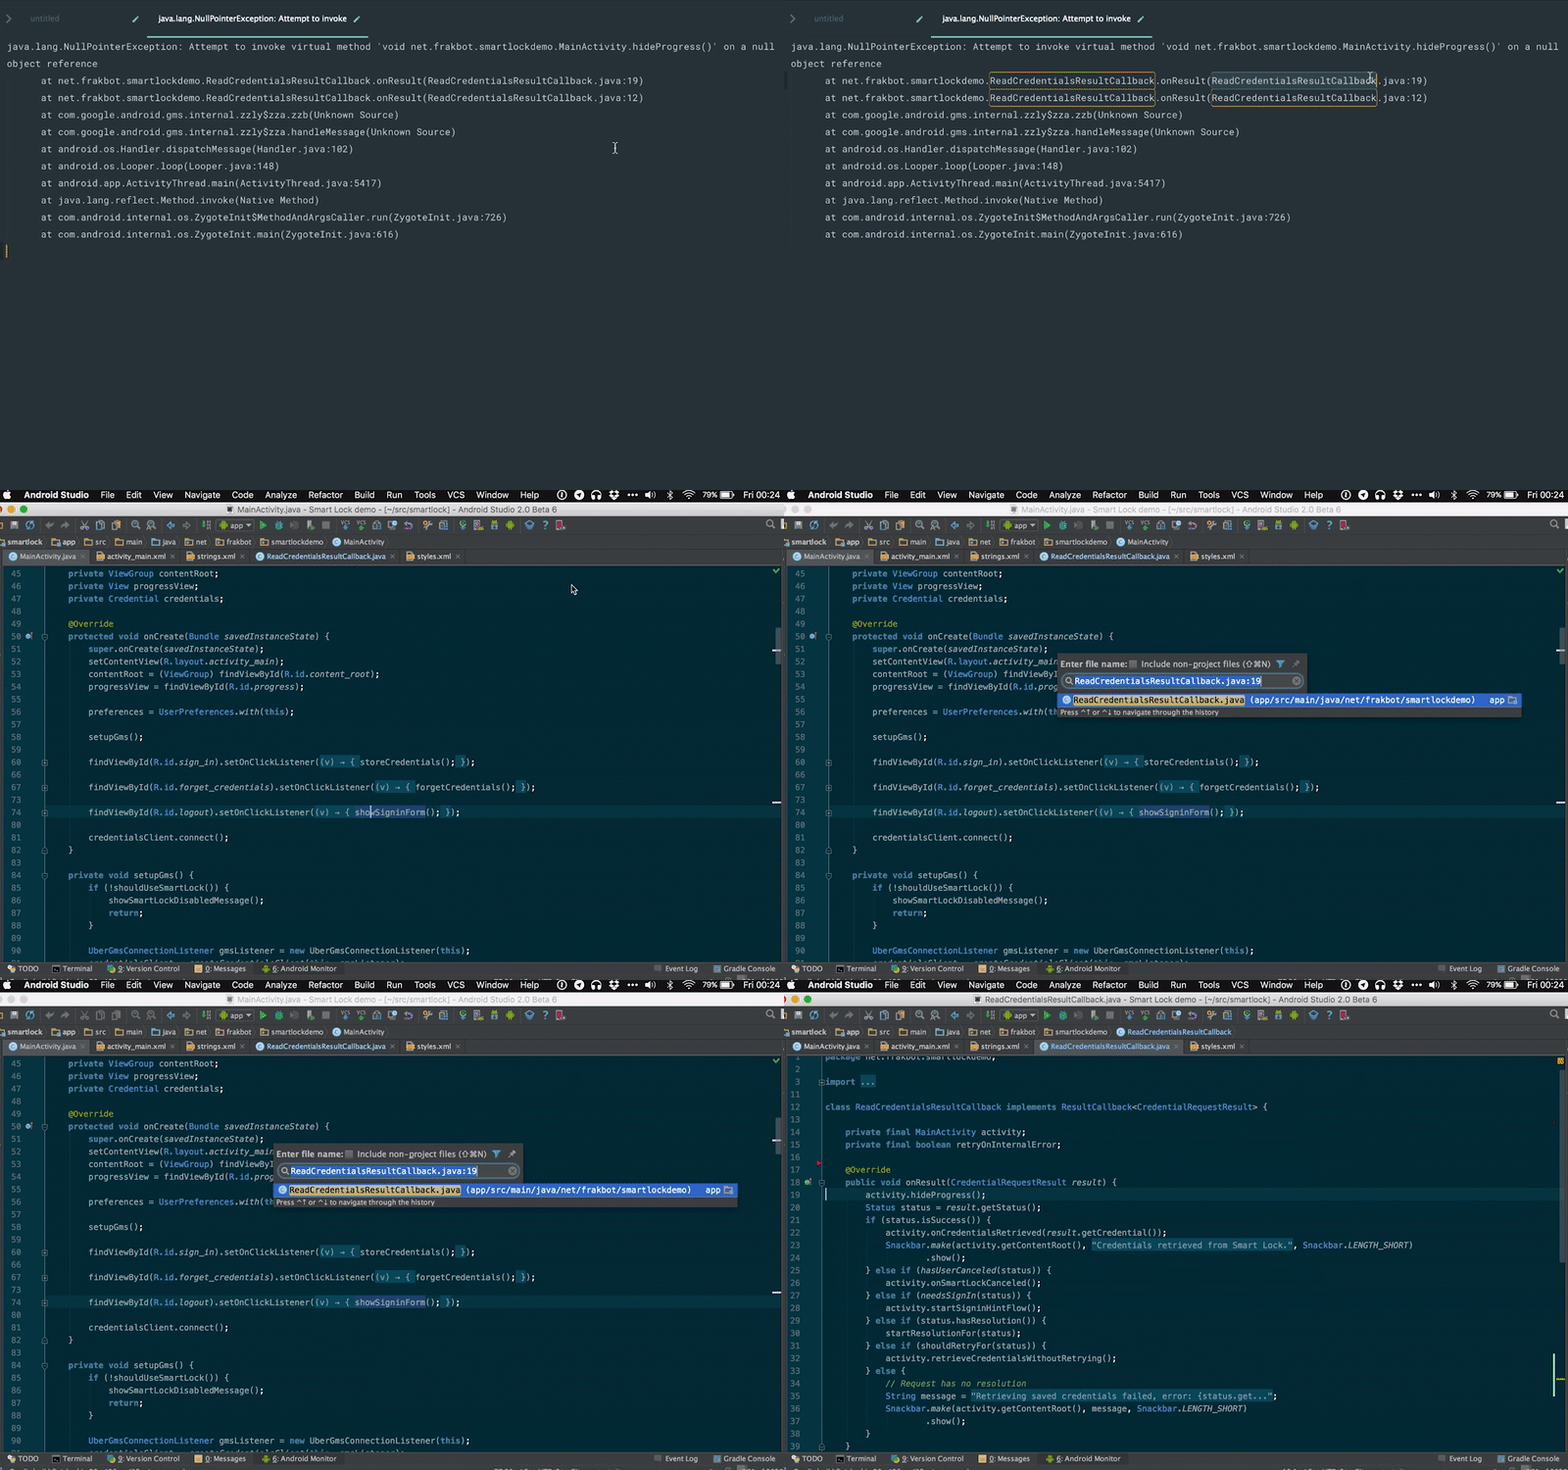
One very little known fact is that in both dialogs you can type in the line you want to go to directly. You simply append a colon followed to the line number. Interestingly enough, this also works for partial matches: you don’t need to type in full names to be able to use this implicit “go to line” functionality.
If you’re a keen-eyed reader, you’ll have likely noticed by now that that is the very same format used in stack traces. This means you can just copy-paste that from the stack trace in the dialog to have the same result as those nice clickable links from the IDE logcat!

But this is not all!
The best way
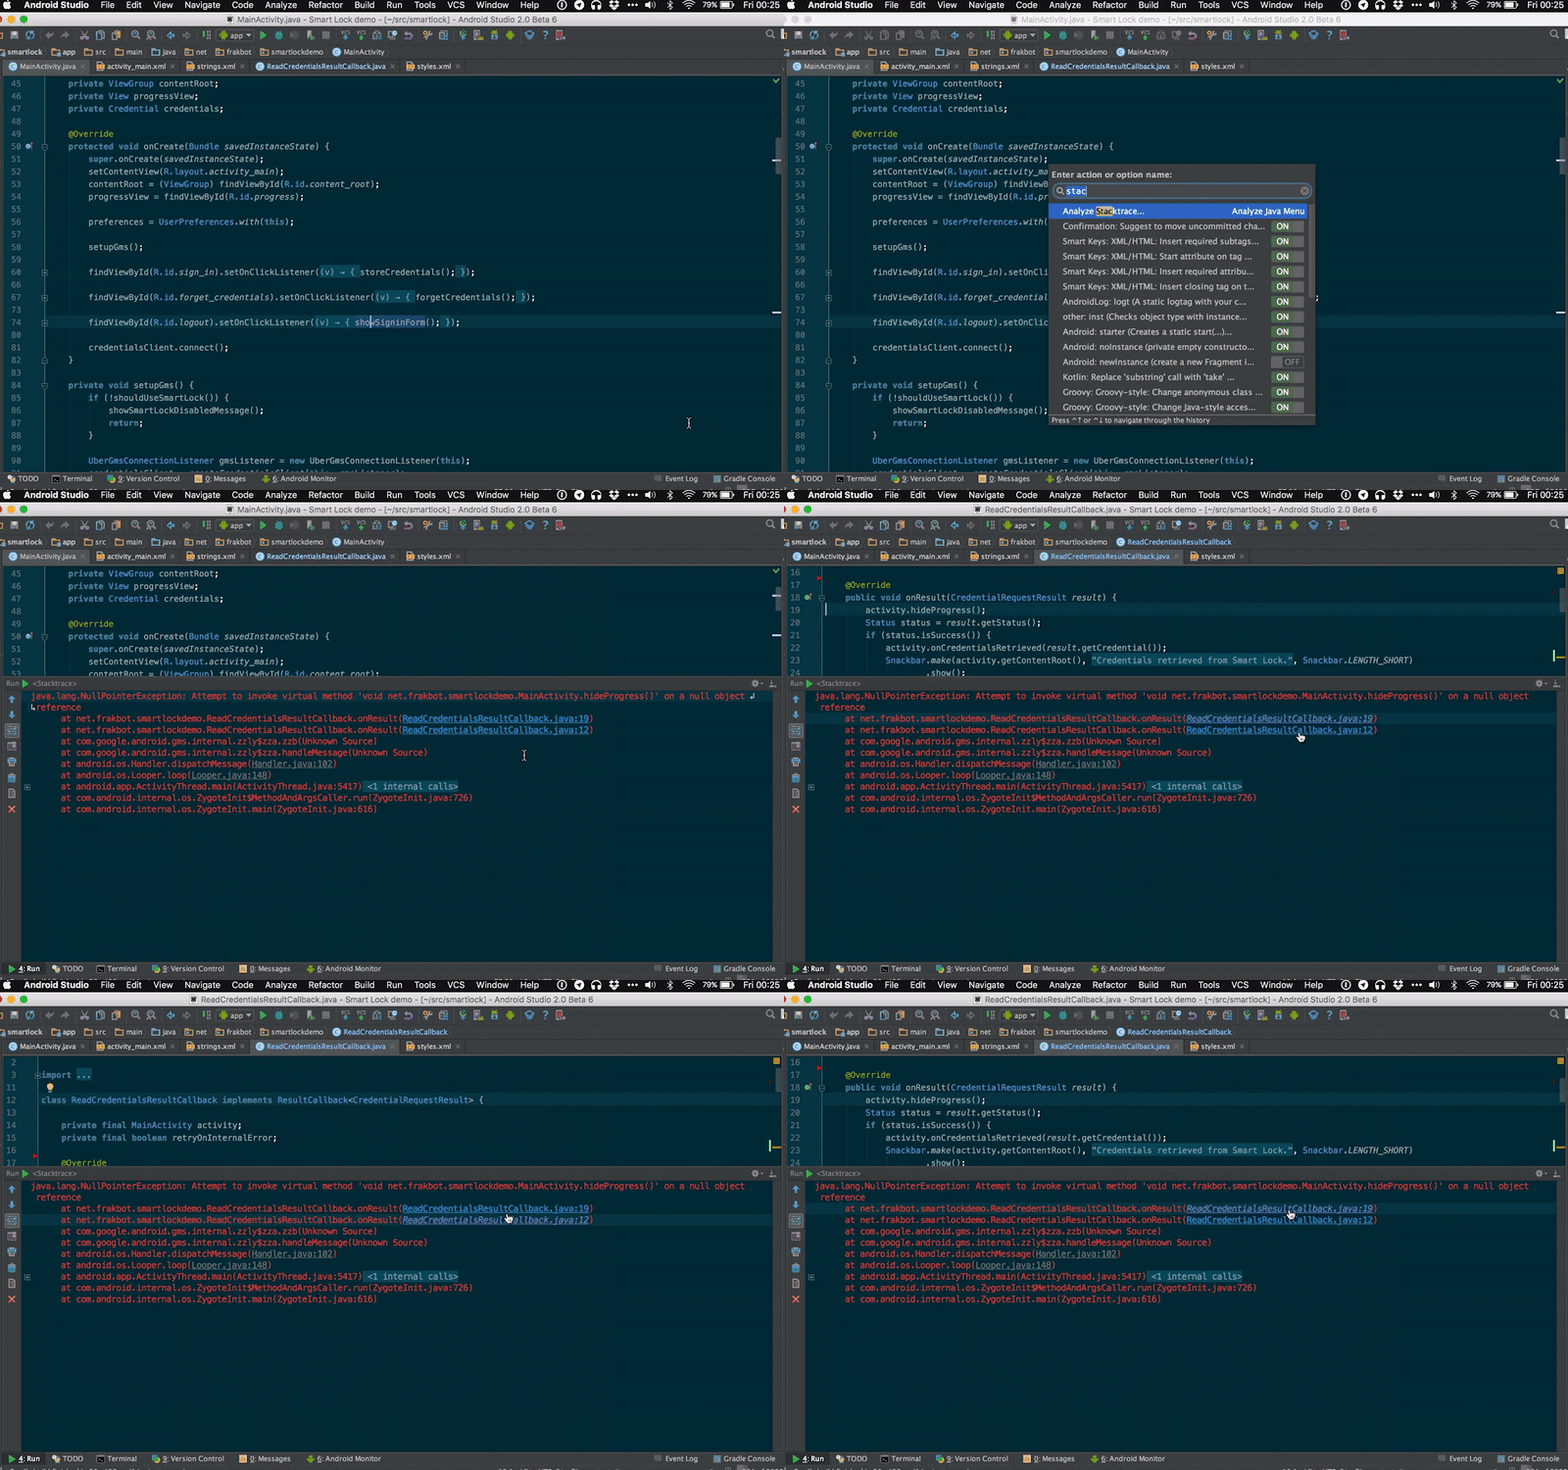
Unbeknownst to most but the most proficient IDE dwellers, and those who casually stumble upon it, the IDE has a rather nice Analyze stack trace functionality. It creates a fully clickable stack trace as if it were originating in the logcat panel.
You can invoke it from the Analyze menu or with the usual Find action dialog (seriously, you should use that, like, all the time! </coolkid>). After pasting in the stack trace, you can easily navigate all the frames it captured with a click!

Want to read more?
You can take a look at the other posts in this series.


